Reliability dashboard
Data is based on customer flights with Skydio X10 between Jan 1st and Mar 31st 2026 unless otherwise noted.
July 3rd, 2026
Reliability Dashboard Update Summary
This dashboard provides transparency into real-world safety and reliability performance across customer operations. Data is updated quarterly with a one-quarter delay to allow for reporting latency and for investigations to complete.
Data from January through March showed an overall 30% improvement over the prior quarter, with gains across all three incident factors. Environmental factors benefited from seasonal effects with lower bird activity as well as software improvements, such as automatic detection of propeller icing to alert users before lift is completely lost. Improvements to autonomy robustness in dynamic lighting and thin-obstacle detection contributed to better technical-factor performance, while increased power efficiency and automatic illumination toggling when operating NightSense with Pathfinder likely contributed to the reduction in human-factor incidents. We’ve also seen a continual increase in Dock-based X10 flight (flown through Remote Flight Deck) as a proportion of the overall fleet, which improves the overall fleet reliability rate since Dock flights remain overall more reliable. The impact of software improvements and more Dock missions is particularly visible in our Cayley release reliability numbers: we shipped a number of reliability improvements, but Cayley was only available to Controller-based X10 flights toward the end of this period and accounted for less than 10% of total flights on the Cayley release.
Incident Rate Breakdown:
Technical Factors
- Technical factors saw a 15% improvement; obstacle avoidance failures are still the largest single category among thin objects and large textureless obstacles. We also continued to have a small trickle of several mitigated issues, with some users not yet replacing Rev 1 propellers or updating to the latest available software.
Human Factors
- Human factors improved by roughly 30% over the prior quarter and 70% year over year. Approximately 40% of these incidents are collisions that occur when obstacle avoidance is disabled or unavailable. Many of these incidents happen at night and, unsurprisingly, incident rates are much higher when flying at night. Overall incident rates at night are nearly 1.5x higher than during the day, and human-factor incidents are more than twice as likely at night. We see this even when NightSense is installed on the aircraft, as operators often disable it, typically to maximize flight time. In Cayley, we introduced several features aimed at reducing these occurrences: lower power consumption for IR NightSense modules via strobing (reducing the need for pilots to manually manage NightSense to stay on scene), plus automatic disabling and re-enabling between Pathfinder waypoints (eliminating the need for pilots to manually track these transitions). To further address these risks, we’re also extending the Pathfinder geofences to manual flight modes as part of the Draper release, which we anticipate will continue to drive these rates down in Q3 and beyond by enabling obstacle avoidance against everything in our data sets, even when visual detection is unavailable.
- We also saw our first mid-air collision between two Skydio X10s in Q1. This risk is now addressed. In Cayley, we launched airspace deconfliction for X10s that share a Dock hive (2 or more Docks in a single location). With the rollout of the Draper release, all Skydio X10s will automatically deconflict airspace. We’re already seeing a steady stream of deconfliction events coming in, highlighting the impact and importance of this feature.
Environmental Factors
- This factor saw a substantial swing from 1:17,282 in Q4 2025 to 1:56,975. This factor is highly sensitive to minor variances in count, though late winter has tended to have fewer bird strikes than other times of year in our data so far, with 2 occurrences despite continually scaling flight volumes. We also had a 'failure to return' incident due to wind speeds building above our maximum airspeed after takeoff, and a propeller icing event. For winds, we expanded our flight envelope when operating with attachments. For icing, there have been no incidents since shipping the automatic icing detection alert in Cayley for Dock and in the Battin release for X10s flown by controller. This alert triggered 37 times during this period, alerting pilots to degraded thrust performance due to ice accumulation before an incident could occur.
Dock Landing Reliability
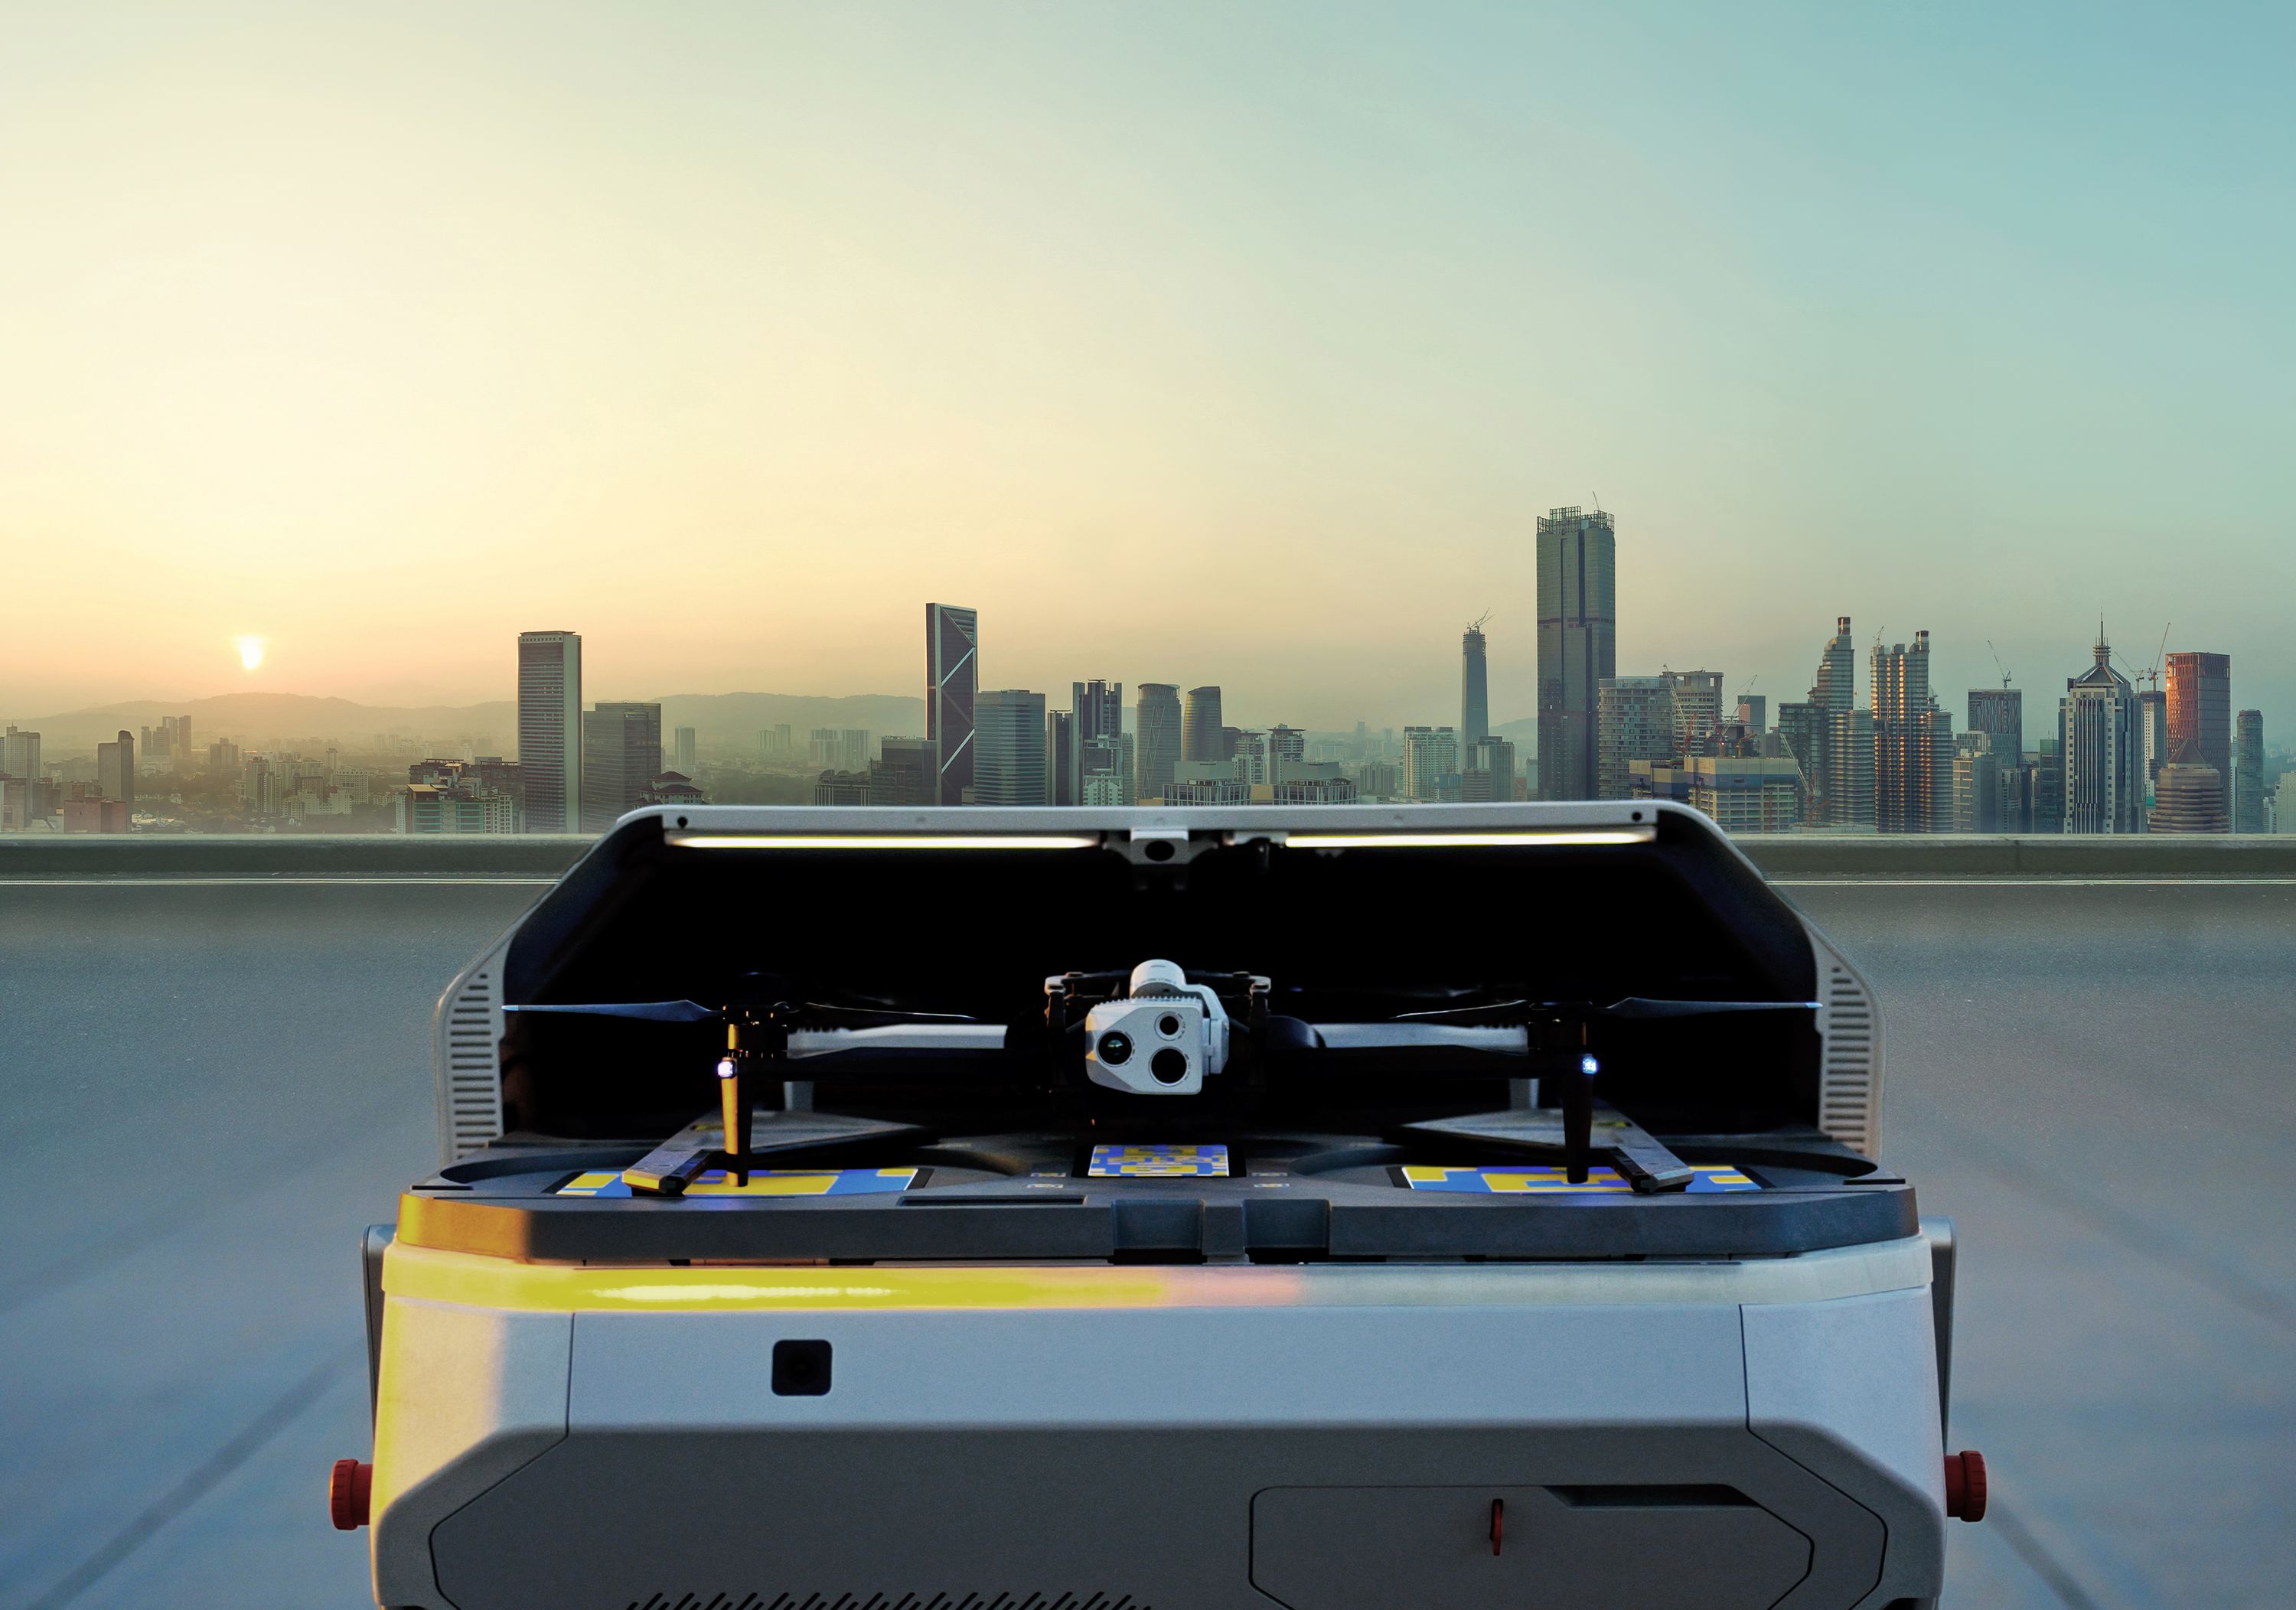
- By the end of the reporting period, X10 was achieving 99.89% landing reliability in Docks. As a reminder, most landings outside of the Dock are not crashes, but instead landings at safe landing zones or next to the Dock, so it is important to designate safe alternate landing sites.
- The trend of Dock-based flight safety vs. Controller-based flight safety has continued, with nearly a 3x reduction in probability of an incident. Dock flights represented nearly 40% of total flight volume, but only 16% of incidents.
Reliability rate
(# of flights between incidents)
Incident rate by factor
Technical malfunctions
Environmental factors
Human factors
Total parachute recoveries
Reliability rate trend
Reliability rate by software release
Flights between incidents per release (lifetime)
Dock landing success
Lifetime flights
Lifetime customer flights and counting (includes S2, X2 and X10)
Reliability is the most important feature.
We believe transparency is a foundational element of safety and reliability. Every time an aviation asset takes to the air, there is some level of risk, whether it’s a commercial jetliner, a crewed helicopter, or a drone. This dashboard is intended to give our customers a data-driven view of the reliability of the systems they are operating so they can exercise their best judgment on how, where, and why to fly.*
These metrics are also part of how we hold ourselves accountable for continual progress. Every Skydio mission with an online drone** contributes to this dashboard. With millions of customer flights in challenging environments, we have the scale and data maturity to detect rare events, validate performance, and continuously improve reliability.
*Always follow Skydio’s safety and operating instructions when you fly. These figures do not predict the outcome of any individual flight, create guarantees or warranties (express or implied), or change the terms of your agreement with Skydio.
**Flights conducted on X10D and X2D systems do not transmit logs or other telemetry and as a result are not represented in the above dashboard.